| |
Visualizing a Map
Description: This tutorial shows you how to visualize a map using ros2djs.Keywords: ros2djs, web interface, javascript, Robot Web Tools
Tutorial Level: BEGINNER
Interactive Marker Example
In this tutorial, we show how to a map in the browser. To begin, create a new HTML document and copy the follow code sample into it.
The HTML Code
   1 <!DOCTYPE html>
   2 <html>
   3 <head>
   4 <meta charset="utf-8" />
   5
   6 <script type="text/javascript" src="http://static.robotwebtools.org/EaselJS/current/easeljs.min.js"></script>
   7 <script type="text/javascript" src="http://static.robotwebtools.org/EventEmitter2/current/eventemitter2.min.js"></script>
   8 <script type="text/javascript" src="http://static.robotwebtools.org/roslibjs/current/roslib.min.js"></script>
   9 <script type="text/javascript" src="http://static.robotwebtools.org/ros2djs/current/ros2d.min.js"></script>
  10
  11 <script type="text/javascript" type="text/javascript">
  12   /**
  13    * Setup all visualization elements when the page is loaded.
  14    */
  15   function init() {
  16     // Connect to ROS.
  17     var ros = new ROSLIB.Ros({
  18       url : 'ws://localhost:9090'
  19     });
  20
  21     // Create the main viewer.
  22     var viewer = new ROS2D.Viewer({
  23       divID : 'map',
  24       width : 600,
  25       height : 500
  26     });
  27
  28     // Setup the map client.
  29     var gridClient = new ROS2D.OccupancyGridClient({
  30       ros : ros,
  31       rootObject : viewer.scene
  32     });
  33     // Scale the canvas to fit to the map
  34     gridClient.on('change', function(){
  35       viewer.scaleToDimensions(gridClient.currentGrid.width, gridClient.currentGrid.height);
  36     });
  37   }
  38 </script>
  39 </head>
  40
  41 <body onload="init()">
  42   <h1>Simple Map Example</h1>
  43   <div id="map"></div>
  44 </body>
  45 </html>
Code Explanation
Now that we have an example, let's look at each piece.
   6 <script type="text/javascript" src="http://static.robotwebtools.org/EaselJS/current/easeljs.min.js"></script>
   7 <script type="text/javascript" src="http://static.robotwebtools.org/EventEmitter2/current/eventemitter2.min.js"></script>
   8 <script type="text/javascript" src="http://static.robotwebtools.org/roslibjs/current/roslib.min.js"></script>
   9 <script type="text/javascript" src="http://static.robotwebtools.org/ros2djs/current/ros2d.min.js"></script>
We first need to import all of the required JavaScript files. Note the addition of the Collada loader. Here, we use the Robot Web Tools CDN.
Next, we need to create a Ros node object to communicate with a rosbridge v2.0 server. In this example, the script will connect to localhost on the default port of 9090.
We then need to create a 2D viewer. We provide the dimensions as well as the HTML div where the viewer will be placed.
This section of code creates the actual OccupancyGridClient object. Here we provide the Ros node object and the viewer's scene to render to. By default, the map will be loaded from the /map topic.
By default, the viewer considers one pixel to represent one meter. This can be easily scaled throughout your application using various functions within ros2djs. Here, we use the scaleToDimensions function to scale the scene to fit inside the given dimensions. This will create the effect of filling the canvas with the map (i.e., zooming in).
41 <body onload="init()">
It is important to remember to call the init() function when this page is loaded. This will call the JavaScript code discussed above.
43 <div id="map"></div>
Within the HTML <body> we create a div with a matching ID for the viewer. This is where the interactive markers will be shown.
Running the Example
At this point we are ready to run the example. To do so, you will need to have map_server, rail_maps, and rosbridge_server installed. Refer to their respective Wiki pages for installation instructions, or simply install their latest builds from the Ubuntu repositories.
Simply launch the necessary nodes with the following (note that the location of your map file may be different):
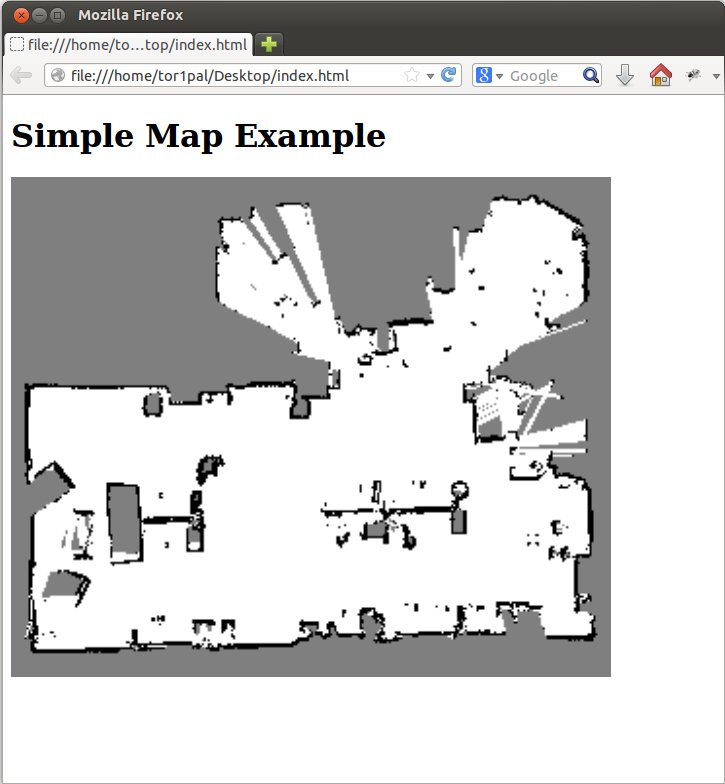
Finally, you are now ready to bring up your HTML page in a web browser. The result should be a page that looks similar to the following:

Support
Please send bug reports to the GitHub Issue Tracker. Feel free to contact us at any point with questions and comments.


